2  Vector Data

2.1 sf package

Package maintained by Pebesma (2018).

© Allison Horst, 2018

Main features:

  • import / export
  • display
  • geoprocessing
  • support for unprojected data (on the globe)
  • use of the simple feature standard
  • compatibility with the pipe operators (|> or %>%)
  • compatibility with tidyverse operators.

2.2 Resources

Exercice

Install the sf package.

2.3 sf format

The three classes used to represent simple features are:

  • sf, the table (data.frame) with feature attributes and feature geometries, which contains
  • sfc, the list-column with the geometries for each feature (record), which is composed of
  • sfg, the feature geometry of an individual simple feature.

We see:

  • in green a simple feature: a single record, or data.frame row, consisting of attributes and geometry
  • in blue a single simple feature geometry (an object of class sfg)
  • in red a simple feature list-column (an object of class sfc, which is a column in the data.frame) that although geometries are native R objects, they are printed as well-known text

2.4 Import and export

The st_read() and st_write() functions can be used to import and export a wide range of file types.

2.4.1 Import

The st_read() function imports geographic layers in sf format.
The following lines import the layer of municipalities in the Lot department provided in the geopackage file lot.gpkg.

library(sf)
#> Linking to GEOS 3.13.0, GDAL 3.10.2, PROJ 9.5.1; sf_use_s2() is TRUE
mun <- st_read("data/lot.gpkg", layer = "communes")
#> Reading layer `communes' from data source 
#>   `/home/tim/Documents/prj/cartography_with_r/data/lot.gpkg' 
#>   using driver `GPKG'
#> Simple feature collection with 313 features and 12 fields
#> Geometry type: MULTIPOLYGON
#> Dimension:     XY
#> Bounding box:  xmin: 539668.5 ymin: 6346290 xmax: 637380.9 ymax: 6439668
#> Projected CRS: RGF93 v1 / Lambert-93
class(mun)
#> [1] "sf"         "data.frame"
Geopackage

The geopackage format lets you store multiple layers in a single file.
The st_layers() function provides an overview of the layers present in a geopackage file.

st_layers("data/lot.gpkg")
#> Driver: GPKG 
#> Available layers:
#>     layer_name geometry_type features fields              crs_name
#> 1     communes Multi Polygon      313     12 RGF93 v1 / Lambert-93
#> 2 departements Multi Polygon       96      5 RGF93 v1 / Lambert-93
#> 3  restaurants         Point      694      2 RGF93 v1 / Lambert-93
#> 4   elevations         Point     5228      1 RGF93 v1 / Lambert-93
#> 5       routes   Line String     1054      2 RGF93 v1 / Lambert-93

2.5 Export

The following lines export the com object to the communes layer of the com.gpkg geopackage in the data folder.

st_write(obj = mun, dsn = "data/com.gpkg", layer = "communes")
#> Writing layer `communes' to data source `data/com.gpkg' using driver `GPKG'
#> Writing 313 features with 12 fields and geometry type Multi Polygon.
Exercice

Import municipalities.

2.6 Explore and display

2.6.1 Overview of variables

The sf objects are data.frame. We can use the head() or summary() functions.

library(sf)
mun <- st_read("data/lot.gpkg", layer = "communes", quiet = TRUE)
head(mun, n = 3)
#> Simple feature collection with 3 features and 12 fields
#> Geometry type: MULTIPOLYGON
#> Dimension:     XY
#> Bounding box:  xmin: 557759.2 ymin: 6371852 xmax: 607179 ymax: 6418606
#> Projected CRS: RGF93 v1 / Lambert-93
#>   INSEE_COM  NOM_COM         STATUT POPULATION     AGR_H    AGR_F     IND_H
#> 1     46001    Albas Commune simple        522  4.978581 0.000000  4.936153
#> 2     46002   Albiac Commune simple         67  0.000000 9.589041  0.000000
#> 3     46003 Alvignac Commune simple        706 10.419682 0.000000 10.419682
#>      IND_F     BTP_H BTP_F     TER_H     TER_F                           geom
#> 1 0.000000  9.957527     0 44.917145 34.681799 MULTIPOLYGON (((559262 6371...
#> 2 0.000000  4.794521     0  4.794521  9.589041 MULTIPOLYGON (((605540.7 64...
#> 3 5.209841 10.419682     0 57.308249 78.147612 MULTIPOLYGON (((593707.7 64...

2.6.2 Plot

Data overview with plot() :

plot(mun)
#> Warning: plotting the first 9 out of 12 attributes; use max.plot = 12 to plot
#> all

Display a single variable:

plot(mun["POPULATION"])

Display geometry only:

plot(st_geometry(mun), col = "ivory4", border = "ivory")

You can also use the mapsf package (Giraud 2023) to display sf objects.

library(mapsf)
mf_map(mun, col = "ivory4", border = "ivory")

Exercice
  1. Plot municpalities with sf. The filling color must be blue and borders must be thick.
  2. Plot municipalities with mapsf. The filling color must be lightgreen and borders must be white and thin.
  3. Add the restaurants to the municpalities map.
  4. How many municipalities are there?
  5. Which commune has the largest population?

2.7 Coordinate Reference Systems (CRS)

2.7.1 Inspect the CRS of an sf object

The st_crs() function lets you inspect the CRS used by an sf object.

library(sf) 
st_crs(x = mun)
#> Coordinate Reference System:
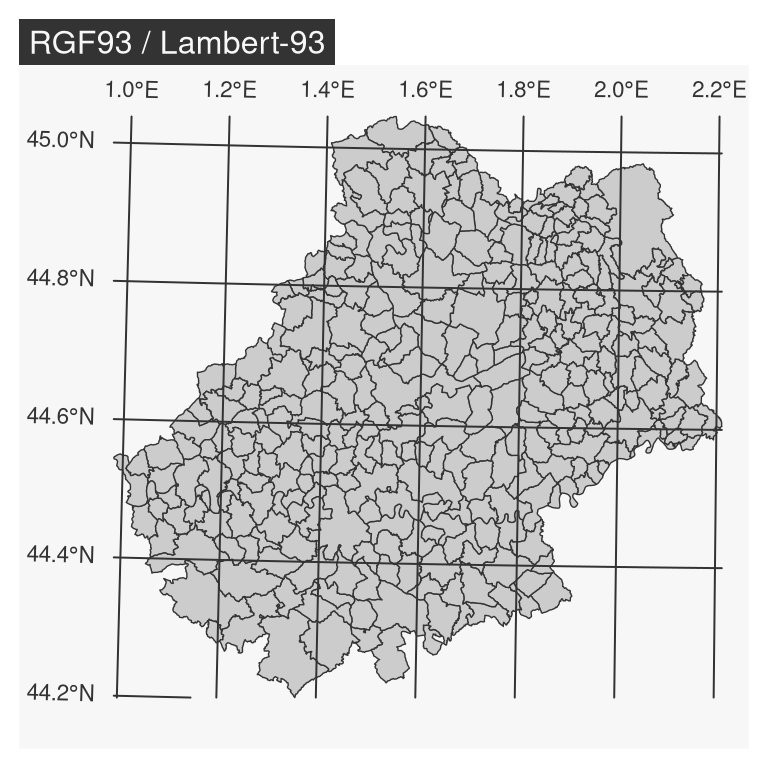
#>   User input: RGF93 v1 / Lambert-93 
#>   wkt:
#> PROJCRS["RGF93 v1 / Lambert-93",
#>     BASEGEOGCRS["RGF93 v1",
#>         DATUM["Reseau Geodesique Francais 1993 v1",
#>             ELLIPSOID["GRS 1980",6378137,298.257222101,
#>                 LENGTHUNIT["metre",1]]],
#>         PRIMEM["Greenwich",0,
#>             ANGLEUNIT["degree",0.0174532925199433]],
#>         ID["EPSG",4171]],
#>     CONVERSION["Lambert-93",
#>         METHOD["Lambert Conic Conformal (2SP)",
#>             ID["EPSG",9802]],
#>         PARAMETER["Latitude of false origin",46.5,
#>             ANGLEUNIT["degree",0.0174532925199433],
#>             ID["EPSG",8821]],
#>         PARAMETER["Longitude of false origin",3,
#>             ANGLEUNIT["degree",0.0174532925199433],
#>             ID["EPSG",8822]],
#>         PARAMETER["Latitude of 1st standard parallel",49,
#>             ANGLEUNIT["degree",0.0174532925199433],
#>             ID["EPSG",8823]],
#>         PARAMETER["Latitude of 2nd standard parallel",44,
#>             ANGLEUNIT["degree",0.0174532925199433],
#>             ID["EPSG",8824]],
#>         PARAMETER["Easting at false origin",700000,
#>             LENGTHUNIT["metre",1],
#>             ID["EPSG",8826]],
#>         PARAMETER["Northing at false origin",6600000,
#>             LENGTHUNIT["metre",1],
#>             ID["EPSG",8827]]],
#>     CS[Cartesian,2],
#>         AXIS["easting (X)",east,
#>             ORDER[1],
#>             LENGTHUNIT["metre",1]],
#>         AXIS["northing (Y)",north,
#>             ORDER[2],
#>             LENGTHUNIT["metre",1]],
#>     USAGE[
#>         SCOPE["Engineering survey, topographic mapping."],
#>         AREA["France - onshore and offshore, mainland and Corsica (France métropolitaine including Corsica)."],
#>         BBOX[41.15,-9.86,51.56,10.38]],
#>     ID["EPSG",2154]]

2.7.2 Transform the CRS of an sf object

The st_transform() function can be used to change the coordinate system of an sf object and reproject it.

mf_map(mun, expandBB = c(0, .12, 0, 0))
mf_graticule(x = mun)
mf_title("RGF93 / Lambert-93")
# CRS change
mun_reproj <- st_transform(x = mun, crs = "EPSG:3035")
mf_map(mun_reproj, expandBB = c(0, .12, .0, 0))
mf_graticule(x = mun_reproj)
mf_title("ETRS89-extended / LAEA Europe")

2.8 Attribute selection and join

2.8.1 Selection by attributes

As sf objects are data.frames, we can select their rows and columns in the same way as data.frames.

# row selection
mun[1:2, ]
#> Simple feature collection with 2 features and 12 fields
#> Geometry type: MULTIPOLYGON
#> Dimension:     XY
#> Bounding box:  xmin: 557759.2 ymin: 6371852 xmax: 607179 ymax: 6410204
#> Projected CRS: RGF93 v1 / Lambert-93
#>   INSEE_COM NOM_COM         STATUT POPULATION    AGR_H    AGR_F    IND_H IND_F
#> 1     46001   Albas Commune simple        522 4.978581 0.000000 4.936153     0
#> 2     46002  Albiac Commune simple         67 0.000000 9.589041 0.000000     0
#>      BTP_H BTP_F     TER_H     TER_F                           geom
#> 1 9.957527     0 44.917145 34.681799 MULTIPOLYGON (((559262 6371...
#> 2 4.794521     0  4.794521  9.589041 MULTIPOLYGON (((605540.7 64...
mun[mun$NOM_COM == "Gramat", ]
#> Simple feature collection with 1 feature and 12 fields
#> Geometry type: MULTIPOLYGON
#> Dimension:     XY
#> Bounding box:  xmin: 593605.6 ymin: 6402330 xmax: 602624.6 ymax: 6413784
#> Projected CRS: RGF93 v1 / Lambert-93
#>     INSEE_COM NOM_COM         STATUT POPULATION    AGR_H    AGR_F    IND_H
#> 119     46128  Gramat Commune simple       3468 10.19868 15.29802 122.3842
#>        IND_F    BTP_H BTP_F    TER_H    TER_F                           geom
#> 119 107.0862 56.09275     0 260.0664 304.1941 MULTIPOLYGON (((594713.1 64...
# column selection
mun[, "POPULATION"]
#> Simple feature collection with 313 features and 1 field
#> Geometry type: MULTIPOLYGON
#> Dimension:     XY
#> Bounding box:  xmin: 539668.5 ymin: 6346290 xmax: 637380.9 ymax: 6439668
#> Projected CRS: RGF93 v1 / Lambert-93
#> First 10 features:
#>    POPULATION                           geom
#> 1         522 MULTIPOLYGON (((559262 6371...
#> 2          67 MULTIPOLYGON (((605540.7 64...
#> 3         706 MULTIPOLYGON (((593707.7 64...
#> 4         219 MULTIPOLYGON (((613211.3 64...
#> 5         329 MULTIPOLYGON (((556744.9 63...
#> 6         377 MULTIPOLYGON (((576667.2 64...
#> 7         988 MULTIPOLYGON (((581404 6370...
#> 8         203 MULTIPOLYGON (((558216 6389...
#> 9         642 MULTIPOLYGON (((612729.6 63...
#> 10        367 MULTIPOLYGON (((581404 6370...
mun[mun$NOM_COM == "Gramat", 1:4]
#> Simple feature collection with 1 feature and 4 fields
#> Geometry type: MULTIPOLYGON
#> Dimension:     XY
#> Bounding box:  xmin: 593605.6 ymin: 6402330 xmax: 602624.6 ymax: 6413784
#> Projected CRS: RGF93 v1 / Lambert-93
#>     INSEE_COM NOM_COM         STATUT POPULATION                           geom
#> 119     46128  Gramat Commune simple       3468 MULTIPOLYGON (((594713.1 64...

2.8.2 Attribute join

We can join a data.frame and an sf object using merge() if they share a common identifier.
Be careful with the order of the arguments, as the object returned will be of the same type as x. It is not possible to make an attribute join using two sf objects.

# import additional data 
mun_df <- read.csv(file = "data/com.csv")

# common identifiers?
names(mun_df)
#> [1] "INSEE_COM" "ACT"       "IND"       "SACT"      "SACT_IND"
names(mun)
#>  [1] "INSEE_COM"  "NOM_COM"    "STATUT"     "POPULATION" "AGR_H"     
#>  [6] "AGR_F"      "IND_H"      "IND_F"      "BTP_H"      "BTP_F"     
#> [11] "TER_H"      "TER_F"      "geom"
# attribute join 
mun_final <- merge(
  x = mun, # the sf object
  y = mun_df, # the data.frame
  by.x = "INSEE_COM", # identifier in x
  by.y = "INSEE_COM", # identifier in y
  all.x = TRUE # keep all lines
)

# the two objects have been joined
head(mun_final, 3)
#> Simple feature collection with 3 features and 16 fields
#> Geometry type: MULTIPOLYGON
#> Dimension:     XY
#> Bounding box:  xmin: 557759.2 ymin: 6371852 xmax: 607179 ymax: 6418606
#> Projected CRS: RGF93 v1 / Lambert-93
#>   INSEE_COM  NOM_COM         STATUT POPULATION     AGR_H    AGR_F     IND_H
#> 1     46001    Albas Commune simple        522  4.978581 0.000000  4.936153
#> 2     46002   Albiac Commune simple         67  0.000000 9.589041  0.000000
#> 3     46003 Alvignac Commune simple        706 10.419682 0.000000 10.419682
#>      IND_F     BTP_H BTP_F     TER_H     TER_F       ACT       IND     SACT
#> 1 0.000000  9.957527     0 44.917145 34.681799  99.47120  4.936153 19.05579
#> 2 0.000000  4.794521     0  4.794521  9.589041  28.76712  0.000000 42.93600
#> 3 5.209841 10.419682     0 57.308249 78.147612 171.92475 15.629522 24.35195
#>   SACT_IND                           geom
#> 1 4.962393 MULTIPOLYGON (((559262 6371...
#> 2 0.000000 MULTIPOLYGON (((605540.7 64...
#> 3 9.090909 MULTIPOLYGON (((593707.7 64...
Exercice
  1. Import the com.csv file. This dataset covers all municipalities and includes several additional variables:
    • working population (ACT)
    • working population in the industrial sector (IND)
    • working population as a percentage of total population (SACT)
    • share of the working population working in the industrial sector (SACT_IND)
  2. Join this dataset to the municipality layer.
  3. Extract municipalities with more than 500 active workers and whose share of active workers in the total population is greater than 30%.
  4. Plot a map with all municipalities in gray and selected municipalities in red.