linemap
Le package linemap (Giraud, 2023a) permet de réaliser des cartes composées de lignes.
library(linemap)
library(sf)
library(terra)
library(mapsf)
com <- st_read("data/lot.gpkg", layer = "communes", quiet = TRUE)
elev <- rast("data/elev.tif")
cahors <- st_buffer(com[com$NOM_COM == "Cahors", ], 5000)
elev_cahors <- crop(elev, cahors)
mf_theme("green")
mf_map(cahors, col = NA, border = NA, expandBB = c(-.05,0,0.05,0))
linemap(x = elev_cahors,
        k = 5,
        bg = getOption("mapsf.bg"),
        add = TRUE, lwd = 1)
mf_title("Altitude vers Cahors")
mf_credits("Giraud & Pecout, 2023")
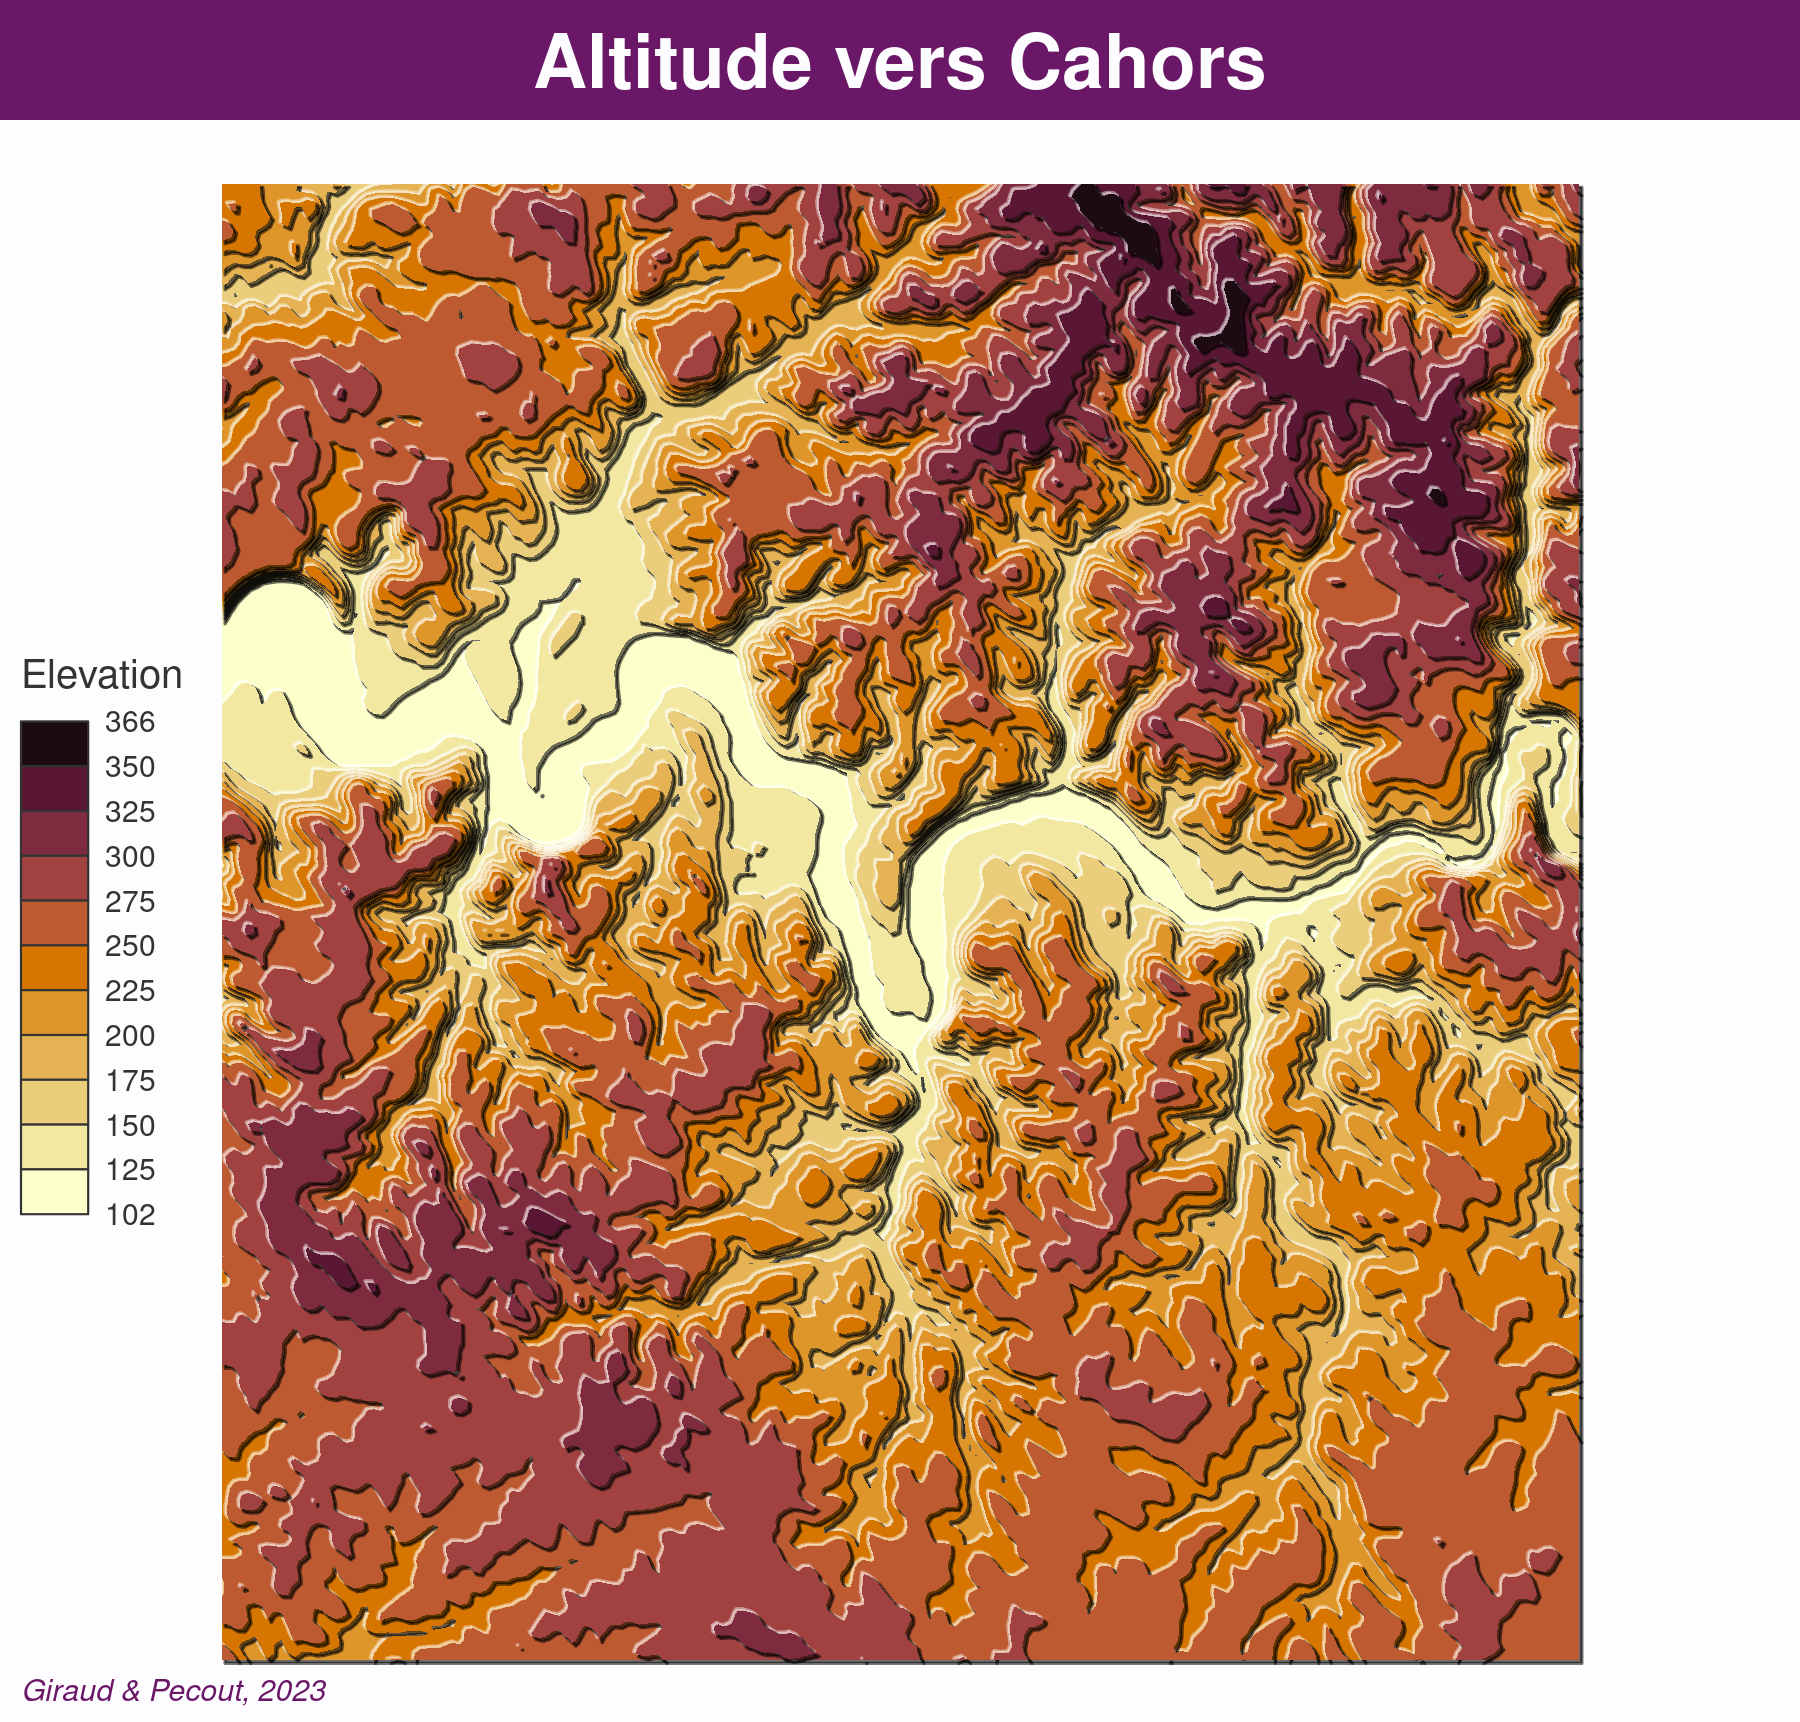
Relief Tanaka
Nous utilisons le package tanaka (Giraud, 2023b) qui met à disposition une méthode (Tanaka, 1950) utilisée pour améliorer la perception du relief.
library(tanaka)
library(terra)
mf_theme("candy")
mf_map(cahors, col = NA, border = NA)
tanaka(elev_cahors,
       breaks = seq(100,375,25),
       col = hcl.colors(11, "Lajolla"),
       add = TRUE)
mf_title("Altitude vers Cahors")
mf_credits("Giraud & Pecout, 2023")
Giraud, T. (2023b).
tanaka: Design Shaded Contour Lines (or Tanaka) Maps.
https://CRAN.R-project.org/package=tanaka
Tanaka, K. (1950). The Relief Contour Method of Representing Topography on Maps.
The Geographical Review,
xl(3).
https://doi.org/doi:10.2307/211219