mapsf update and maplegend introduction

mapsf
maplegend
Author

Timothée Giraud

Published

November 24, 2023

An update of mapsf has been deployed on CRAN. In this article I will describe the changes introduced by this update.

The two main points are:

Legends

One of the main change introduced in the lastest release of mapsf is the use of the maplegend (Giraud 2023) package to plot all legends.

The maplegend package

maplegend is a new package offering a wide range of legends. This package is primarily intended as a backend for building legends in mapsf. However, it can also be used independently from mapsf with base plots or even with igraph plots.

The main function is leg(). Its type argument defines the legend type.

Code
library(maplegend)
library(mapsf)
m <- mf_get_mtq()
mf_map(m, col = "grey90", border = "grey80")
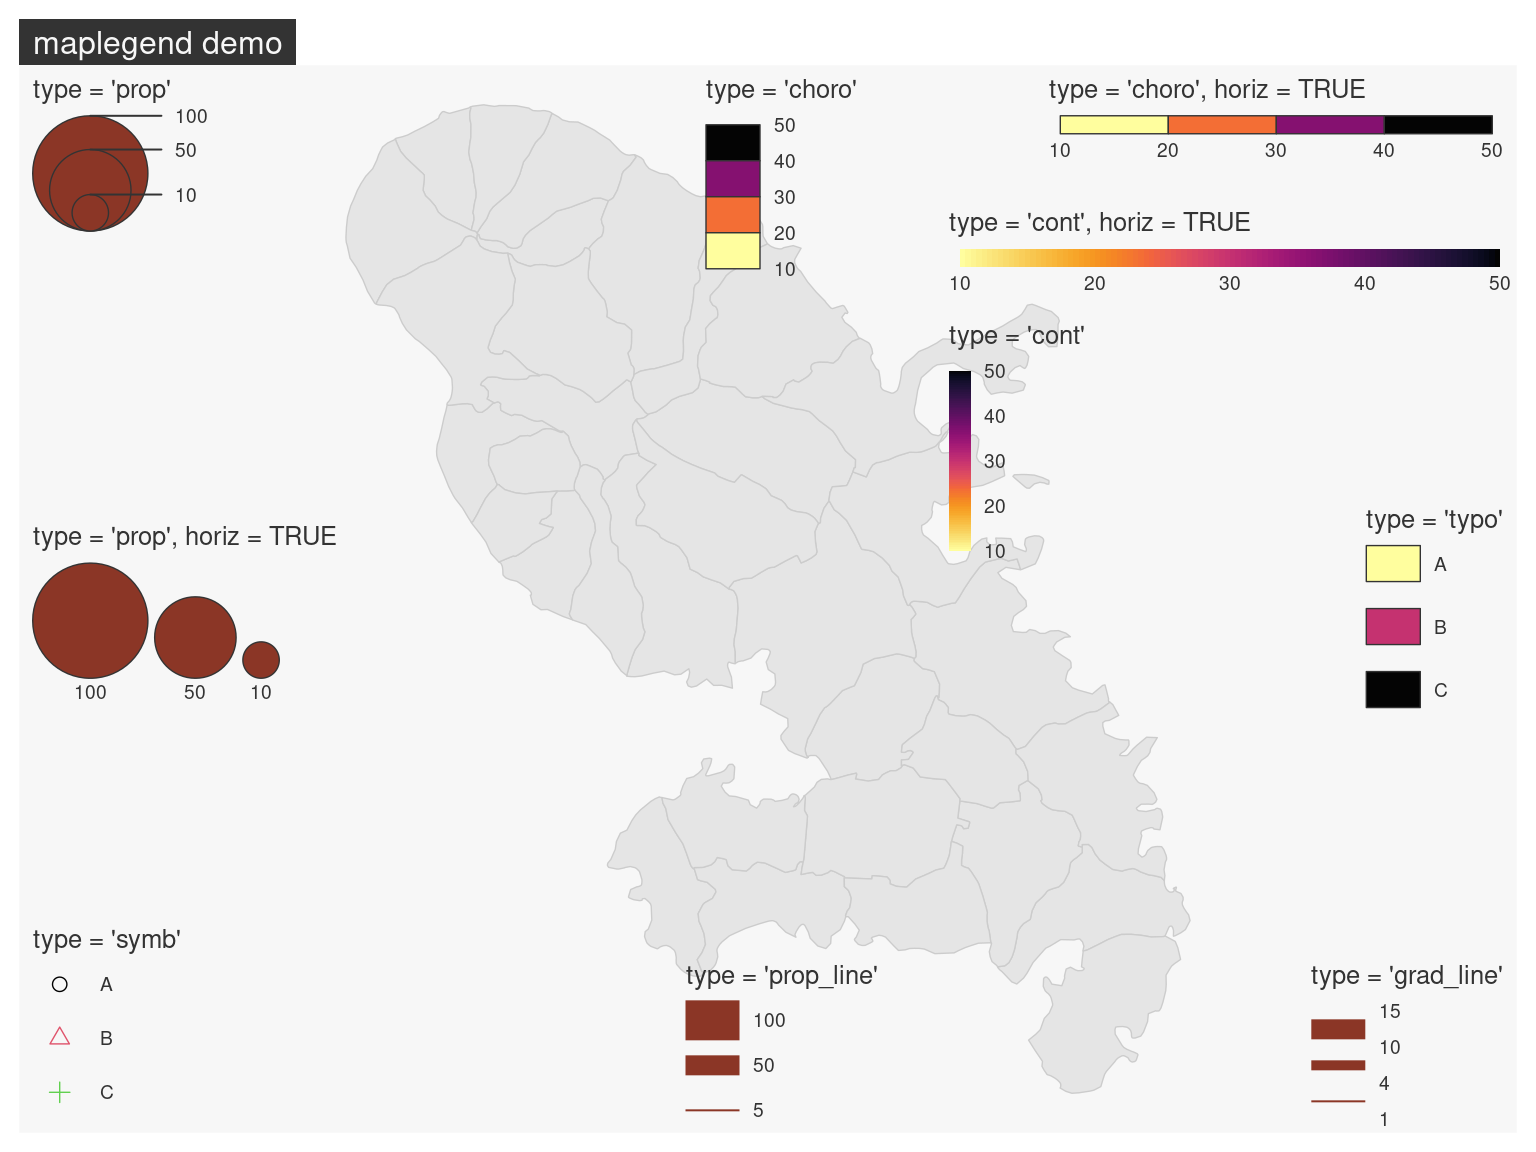
mf_title("maplegend demo")

# Proportional symbols
leg(type = "prop", val = c(10, 50, 100), pos = "topleft", 
    mar = getOption("mapsf.mar"), 
    title = "type = 'prop'")
leg(type = "prop", val = c(10, 50, 100), pos = "left", 
    horiz = TRUE, mar = getOption("mapsf.mar"), 
    title = "type = 'prop', horiz = TRUE")

# Choropleth 
leg(type = "choro", val = c(10, 20, 30, 40, 50), pos = "top",
    title = "type = 'choro'")
leg(type = "choro", val = c(10, 20, 30, 40, 50), pos = "topright", 
    horiz = TRUE,
    title = "type = 'choro', horiz = TRUE")

# Typologie
leg(type = "typo", val = c("A", "B", "C"), pos = "right", 
    title = "type = 'typo'")

# Symbols
leg(type = "symb", val = c("A", "B", "C"), pos = "bottomleft", 
    pal = 1:3, 
    title = "type = 'symb'")

# Continuous
leg(type = "cont", val = c(10, 20, 30, 40, 50), pos = c(722257.6, 1640619), 
    horiz = TRUE,
    title = "type = 'cont', horiz = TRUE")
leg(type = "cont", val = c(10, 20, 30, 40, 50), pos = c(722257.6, 1634576), 
    title = "type = 'cont'")

# Proportional lines
leg(type = "prop_line", val = c(5, 50, 100), pos = "bottom", 
    lwd = 20, 
    title = "type = 'prop_line'")

# Graduated lines
leg(type = "grad_line", val = c(1, 4, 10, 15), pos = "bottomright", 
    lwd = c(1, 5, 10), 
    title = "type = 'grad_line'")

Compound or stacked legends can be created with leg_comp() and leg_draw().

mf_map(m)
mf_title("Stacked legends")
leg_comp(type = "prop", val = c(10, 50, 100)) |>
  leg_comp(type = "typo", val = c("A", "B", "C")) |>
  leg_draw(pos = "bottomleft", bg = "lightblue", fg = "darkblue", 
           frame_border = NA, mar = getOption("mapsf.mar"), size = .9)

maplegend and mapsf
  • You can use maplegend::leg() on maps created with mapsf but the preferred way is to use the mf_legend() function, which wraps maplegend::leg() with default values consistent with the current theme.

  • If you need to use maplegend with mapsf maps, to create compound legends for example, remember to fill the mar argument with the margin values of the current theme (getOption("mapsf.mar")) when using proportional symbols legends.

Legends in mapsf

A consequence of using maplegend in mapsf is the addition of several legend-related arguments in mf_map() to refine the legend display : leg_frame_border, leg_horiz, leg_adj, leg_bg, leg_fg, leg_size, leg_border, leg_box_border, leg_box_cex.

mf_map(m, "MED", type = "choro", 
       leg_pos = 'topright',
       leg_val_rnd = -2,
       leg_horiz = TRUE, 
       leg_box_border = NA,
       leg_box_cex = c(.6,2),
       leg_title = "Median Income"
       )
mf_map(m, "POP", type = "prop", 
       leg_title = 'Population',
       leg_pos = "bottomleft",
       leg_size = 2, 
       leg_frame = TRUE, 
       leg_bg = "ivory3", 
       leg_fg = "tomato4", 
       leg_frame_border = NA, 
       leg_adj = c(0, 2))
mf_credits("TG 2023\nmapsf v0.8.0")
mf_title("mf_map(..., leg_*) demo")

Legends for continuous rasters have been introduced.

r <- terra::rast(system.file("ex/elev.tif", package = "terra"))
mf_raster(r)
mf_title("Legends for continuous rasters")

Support for “classes” and “interval” types will be added in future versions.

Warning

All mf_legend_*() function are deprecated. Use mf_legend() with the appropriate type instead.

New features

mf_distr()

mf_distr() is a function that displays a statistical distribution using a histogram, a box plot, a strip chart and a density curve on the same plot.
This function was introduced to help users choose a method for creating class intervals.

library(mapsf)
mf_distr(rnorm(1000))

rev argument

A rev argument has been added in mf_map().
rev = TRUE reverses the color order of the named palettes specified with the pal argument.

mf_theme("default", mar = c(0, 0, 0, 0))
mf_map(m, "MED", type = "choro", breaks = "quantile", 
       pal = "Inferno")
mf_theme("green", mar = c(0, 0, 0, 0))
mf_map(m, "MED", type = "choro", breaks = "quantile", 
       pal = hcl.colors(7,"Inferno"), rev = T)


See the NEWS file for the complete list of changes.

References

Giraud, Timothée. 2023. maplegend: Legends for Maps. https://CRAN.R-project.org/package=maplegend.