library(linemap)
r <- terra::rast(system.file("tif/elevation.tif", package = "linemap"))
opar <- par(mar = c(0,0,0,0), bg = "grey10")
linemap(r)
par(opar)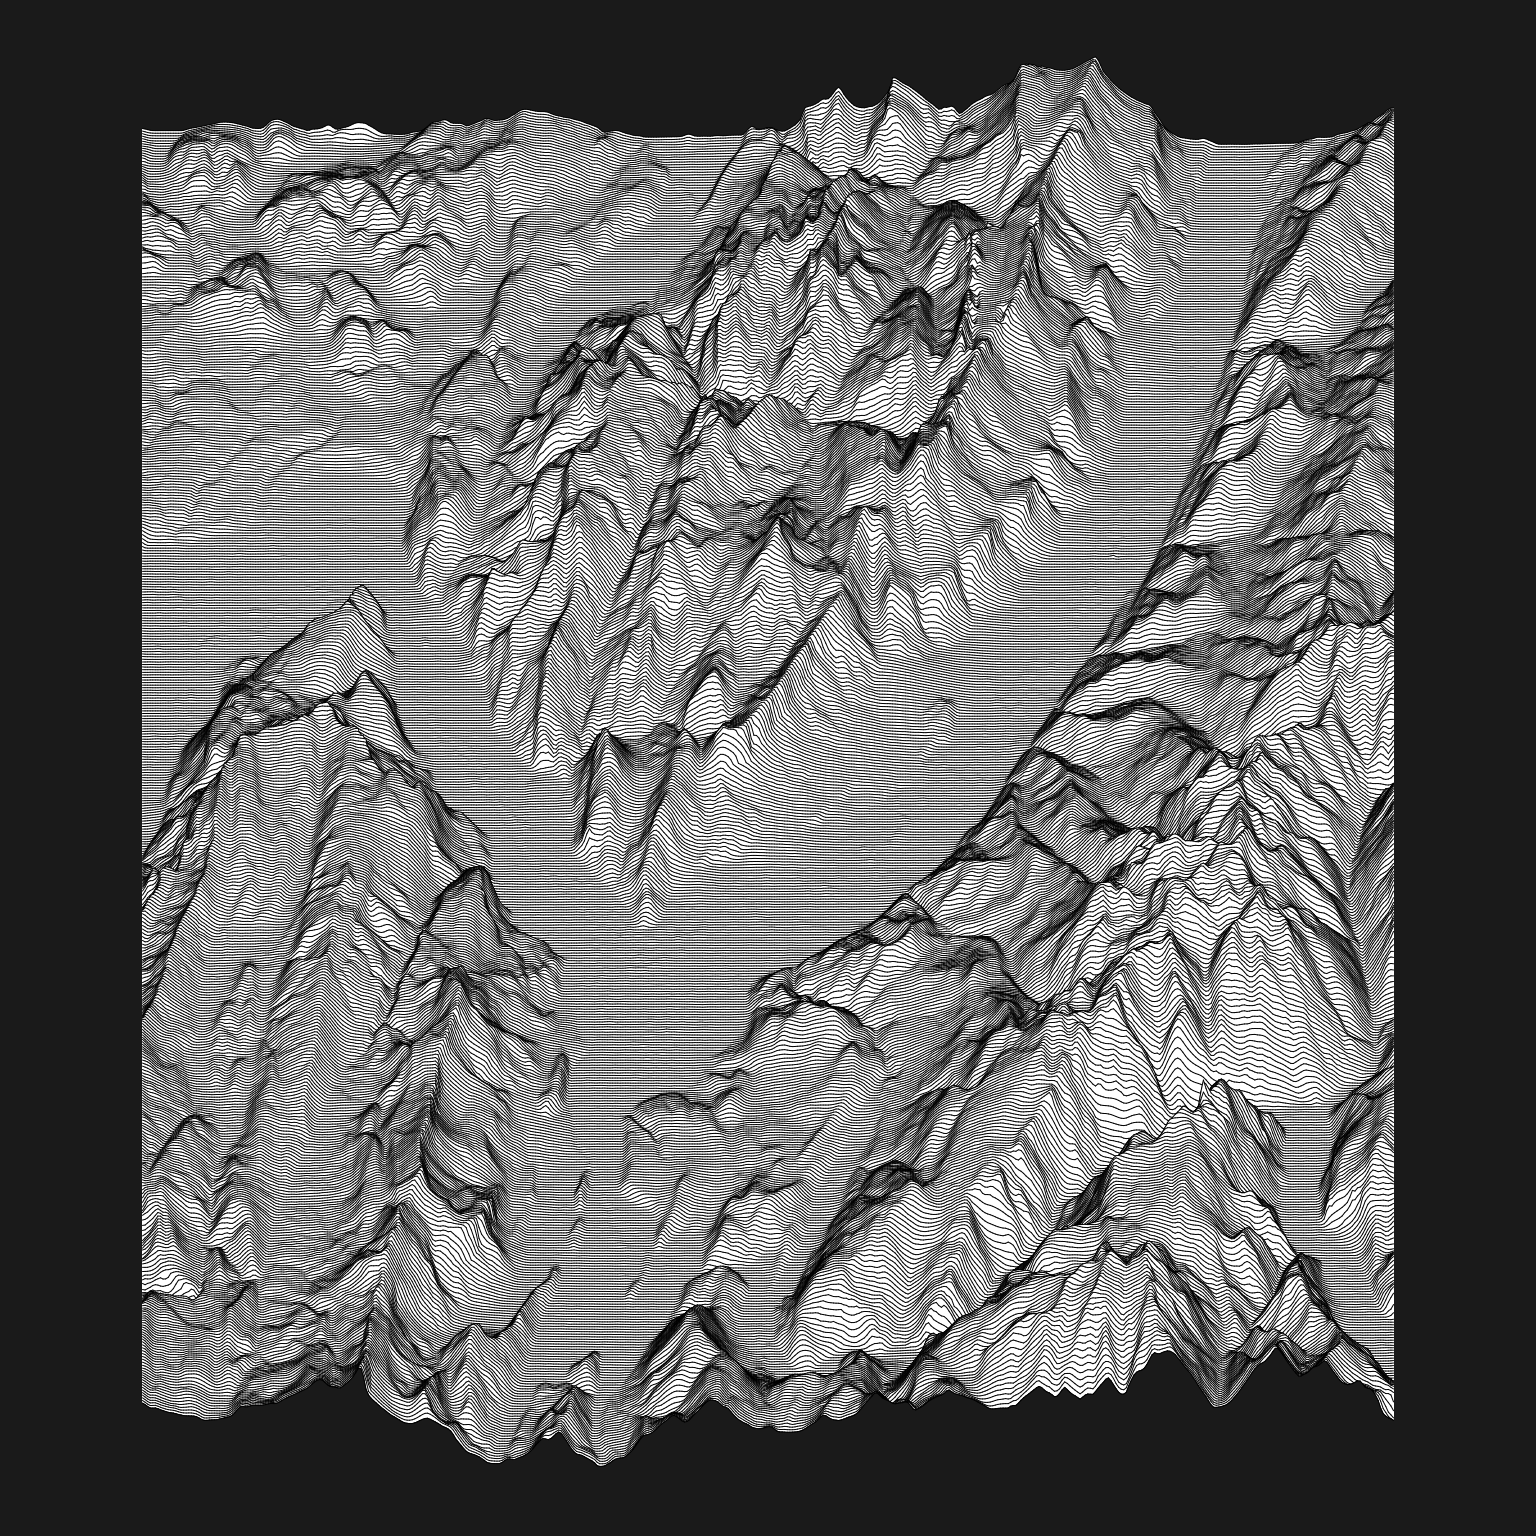
linemap update![]() The
The linemap package (Giraud 2023) contains just one function: linemap(). linemap() displays a map made of lines using raster or gridded data.
In the previous version of the package, linemap() only accepted as input a data.frame of gridded data (in its long form: lon, lat, value). That was highly impractical.
The main change introduced by this release is the ability to use a raster as input (aSpatRaster from terra).
In this example we use the sample dataset shipped with the package. elevation.tif is an elevation raster of Grenoble and the surrounding area (from SRTM).
library(linemap)
r <- terra::rast(system.file("tif/elevation.tif", package = "linemap"))
opar <- par(mar = c(0,0,0,0), bg = "grey10")
linemap(r)
par(opar)
We can use any kind of raster data. The following example uses gridded population data.
# data preparation
library(terra)
library(sf)
# Download
tempzip <- tempfile()
tempfolder <- tempdir()
data_url <- paste0("http://cidportal.jrc.ec.europa.eu/ftp/jrc-opendata/GHSL/",
                   "GHS_POP_GPW4_GLOBE_R2015A/GHS_POP_GPW42015_GLOBE_R2015A_54009_1k/",
                   "V1-0/GHS_POP_GPW42015_GLOBE_R2015A_54009_1k_v1_0.zip")
download.file(data_url, tempzip)
unzip(tempzip, exdir = tempfolder)
# Import
pop2015 <- rast(paste0(tempfolder,
                       "/GHS_POP_GPW42015_GLOBE_R2015A_54009_1k_v1_0/",
                       "GHS_POP_GPW42015_GLOBE_R2015A_54009_1k_v1_0.tif"))
# Mask raster
center <- st_as_sf(data.frame(x=425483.8, y=5608290),
                   coords=(c("x","y")),
                   crs = st_crs(pop2015))
center <- st_buffer(center, dist = 800000)
ras <- crop(pop2015, st_bbox(center)[c(1,3,2,4)])
# Smooth values
model_r <- ras
res(model_r) <- c(5000, 10000)
ras_res <- resample(ras, model_r, method = "sum")
r <- mask(ras_res, center)library(mapsf)
mf_theme(mar = c(0,0,0,0))
mf_map(center, col = "black", border = "black", lwd = 4)
linemap(r, k = .5, col = "black", border = "white", lwd = 1, add= TRUE)
mf_title(txt = "Population", inner = TRUE, bg = "#f7f7f7",
fg = "#333333", line = 2, cex = 1.5)
mf_credits(paste0("T. Giraud, 2023\n",
"Data : European Commission, Joint Research Centre (JRC); ",
"Columbia University, CIESIN (2015): GHS population grid, ",
"derived from GPW4."))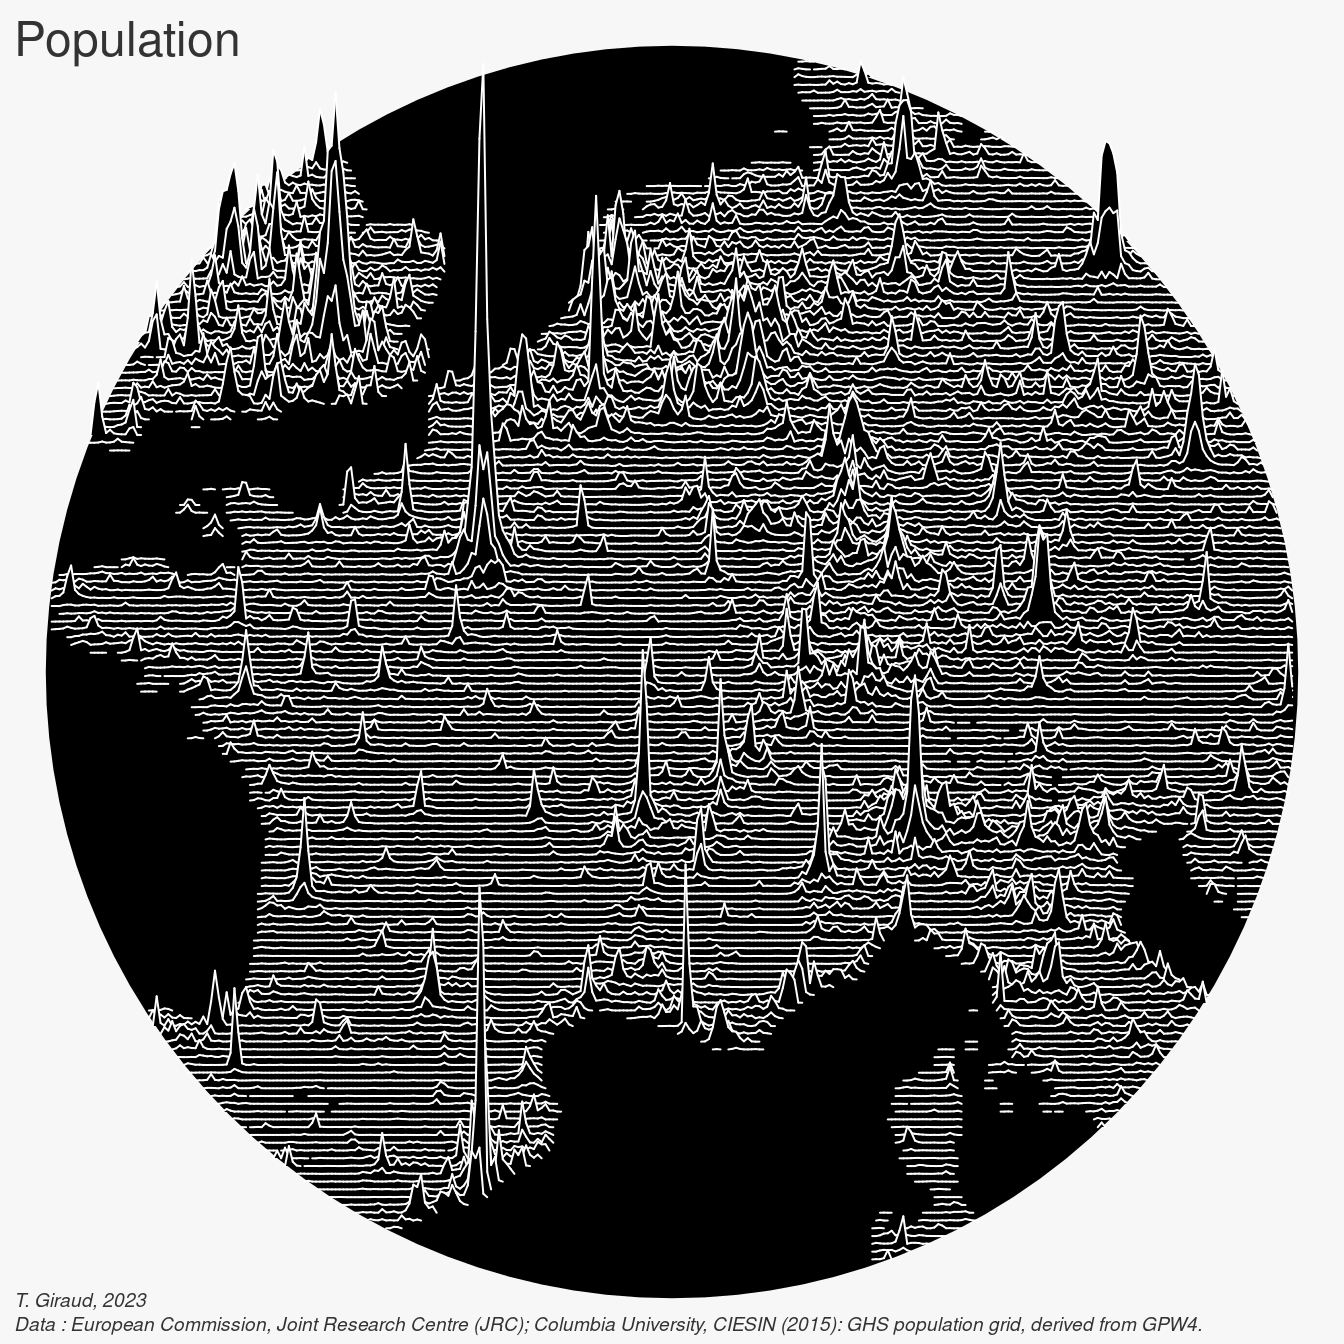
linemap repository on GitHub: github.com/riatelab/linemap