```{r}
library(mapsf)
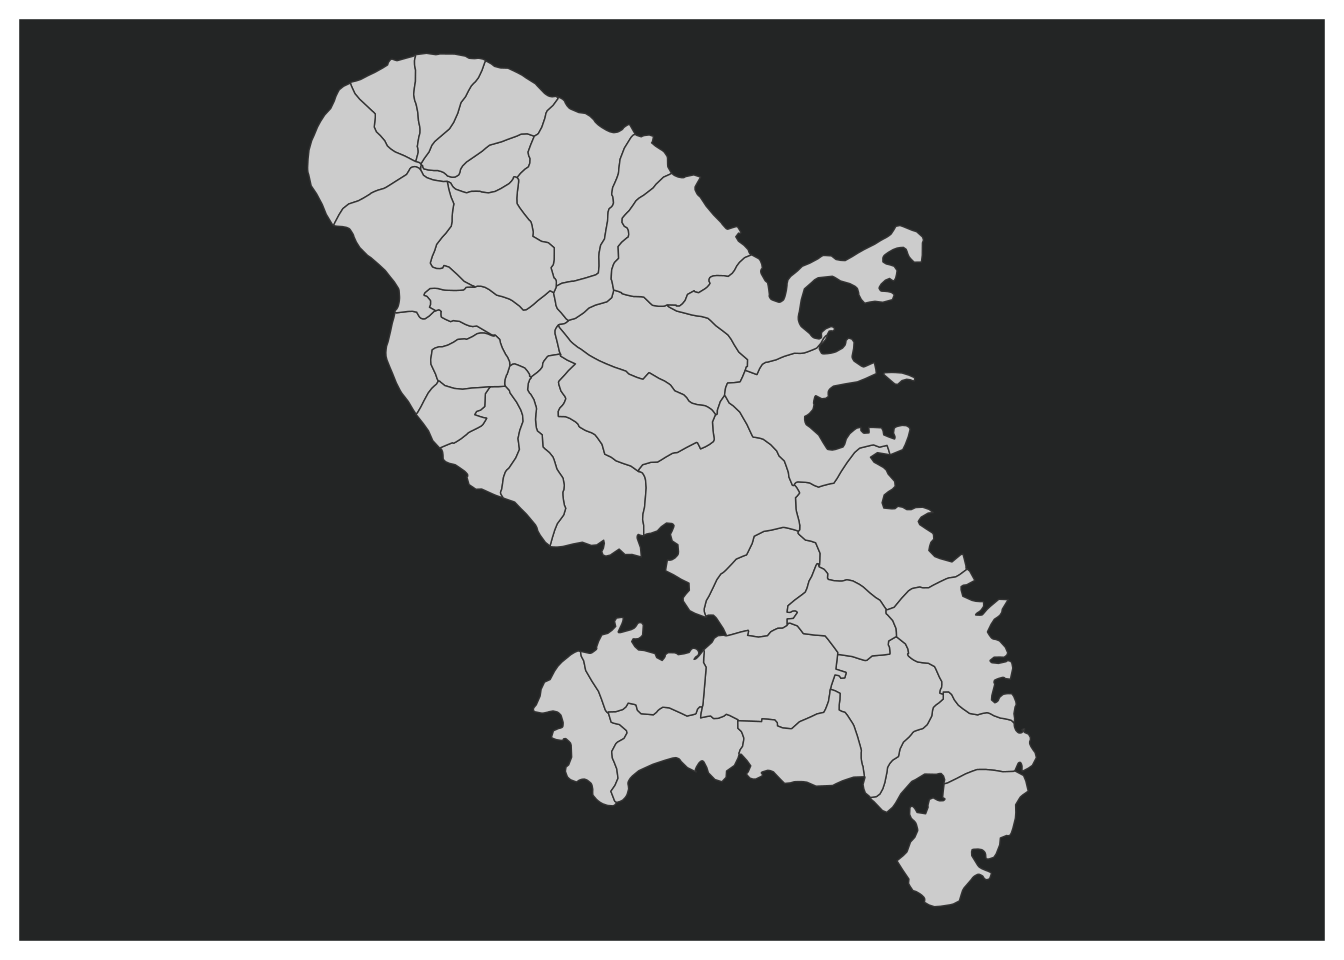
mtq <- mf_get_mtq()
mf_theme("darkula")
mf_map(mtq)
```
mapsfThe R spatial ecosystem is rich, dynamic and mature and several packages allow to import, process and represent spatial data. The mapsf package (Giraud 2022) relies on this ecosystem to integrate the creation of quality thematic maps in R workflows. mapsf uses sf objects to produce base graphics.
A minor update of mapsf has been deployed on CRAN. In this article I’ll describe the changes introduced by this update. mapsf has noticeably gained a new function, mf_get_ratio(), that helps to create map figures with suitable width / height ratios. Most of the other changes are bug fixes and small improvements.
mf_get_ratio()mf_get_ratio() can be used to create map figures with a suitable width / height ratio in reports (*.Rmd, *.qmd).
It uses the width / height ratio of a spatial object bounding box to find a matching ratio for the map.
The following quarto example uses the default figure output settings (7 x 5 inches):
```{r}
library(mapsf)
mtq <- mf_get_mtq()
mf_theme("darkula")
mf_map(mtq)
```
The width / height ratio of this figure is not optimal, it produces a lot of unused space on the sides of the map. It is not easy to find a correct ratio without manually fiddling with the fig-width and fig-height values and this can be exhausting.
mf_get_ratio() helps with this task:
mf_get_ratio(x = mtq, height = 5, theme = "darkula")[1] 4.3 5.0We can use these values to obtain a much more satisfactory figure:
```{r}
#| fig-width: 4.3
#| fig-height: 5
mf_theme("darkula")
mf_map(mtq)
```
The mf_init() function can be used to expand the map space in any direction thanks to its expandBB argument.
Lets say we want to produce a figure that uses the ink theme, with a height of 5 inches and some space left on the right of the map.
mf_get_ratio(
  x = mtq,
  height = 5,
  theme = "ink",
  expandBB = c(0, 0, 0, .5)
)
[1] 5.95 5.00```{r}
#| fig-width: 5.95
#| fig-height: 5
mf_init(x = mtq, expandBB = c(0, 0, 0, .5), theme = "ink")
mf_map(mtq, add = TRUE)
mf_title("Martinique")
```
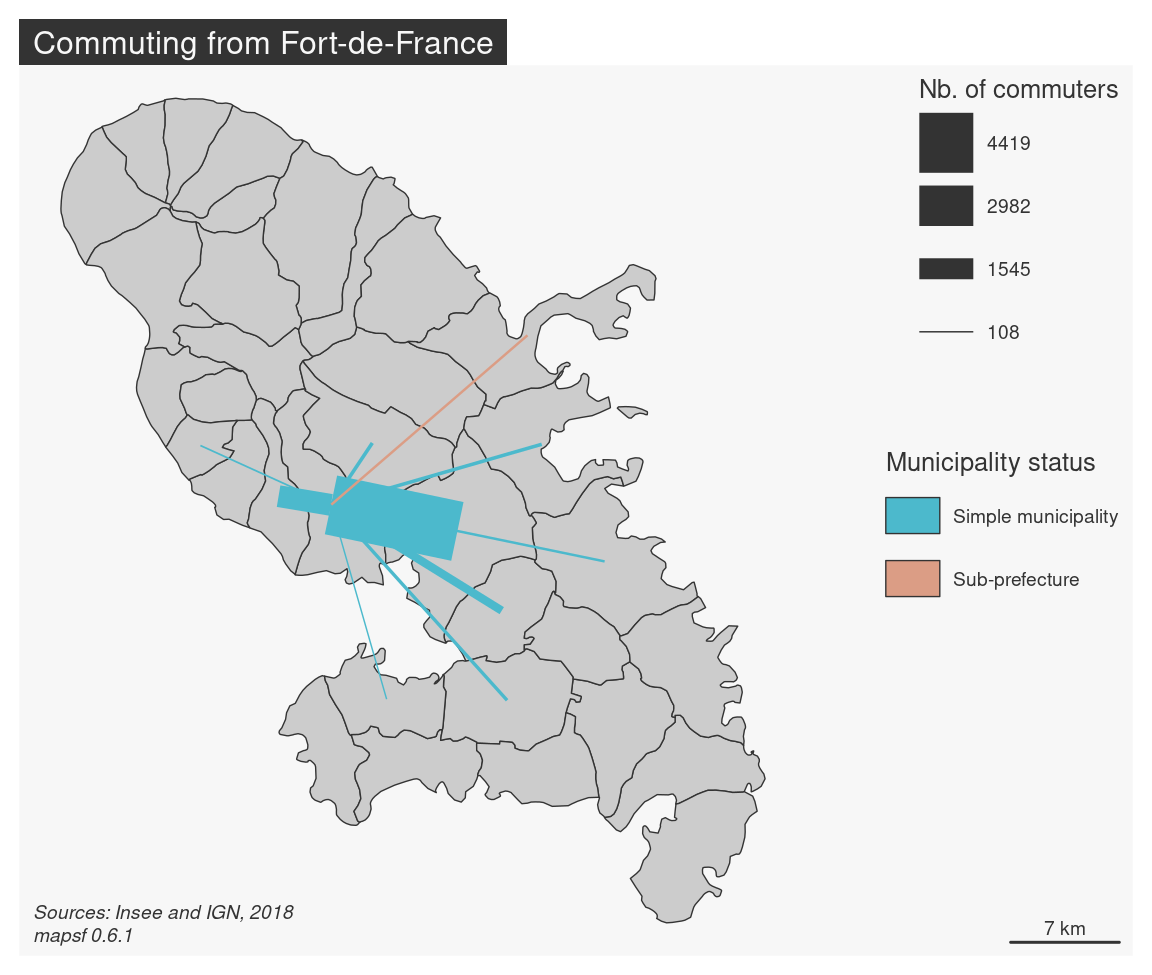
It is now possible to create maps that combine proportional lines and colors using the prop_typo map type.
mf_theme("default")
mtq <- mf_get_mtq()
# import the csv file embedded in mapsf
mob <- read.csv(system.file("csv/mob.csv", package = "mapsf"))
# Select links from Fort-de-France (97209))
mob_97209 <- mob[mob$i == 97209, ]
# create an sf object of links
mob_links <- mf_get_links(x = mtq, df = mob_97209)
# initiate a map with some space on the right
mf_init(mtq, expandBB = c(0,0,0,.5))
mf_map(mtq, add = TRUE)
mf_map(
  x = mob_links,
  var = c("fij", "sj"),
  type = "prop_typo",
  lwd_max = 30,
  leg_pos = c("topright", "right"),
  leg_title = c("Nb. of commuters",
                "Municipality status")
)
# map layout
mf_layout(
  title = "Commuting from Fort-de-France",
  credits = paste0(
    "Sources: Insee and IGN, 2018\n",
    "mapsf ", packageVersion("mapsf")
  ),
  arrow = FALSE
)
NA, 0, Inf or negative values.library(mapsf)
# import sample dataset
mtq <- mf_get_mtq()
# introduce NA, 0, Inf and negative values
mtq[1:8, "POP"] <- c(0, 0, NA, NA, Inf, -Inf, -10000, -20000)
# display basemap
mf_map(mtq)
mf_map(x = mtq, var = "POP", type = "prop")2 'NA' values are not plotted on the map.2 '0' values are not plotted on the map.2 'Infinite' values are not plotted on the map.Negative values have been transformed into positive values.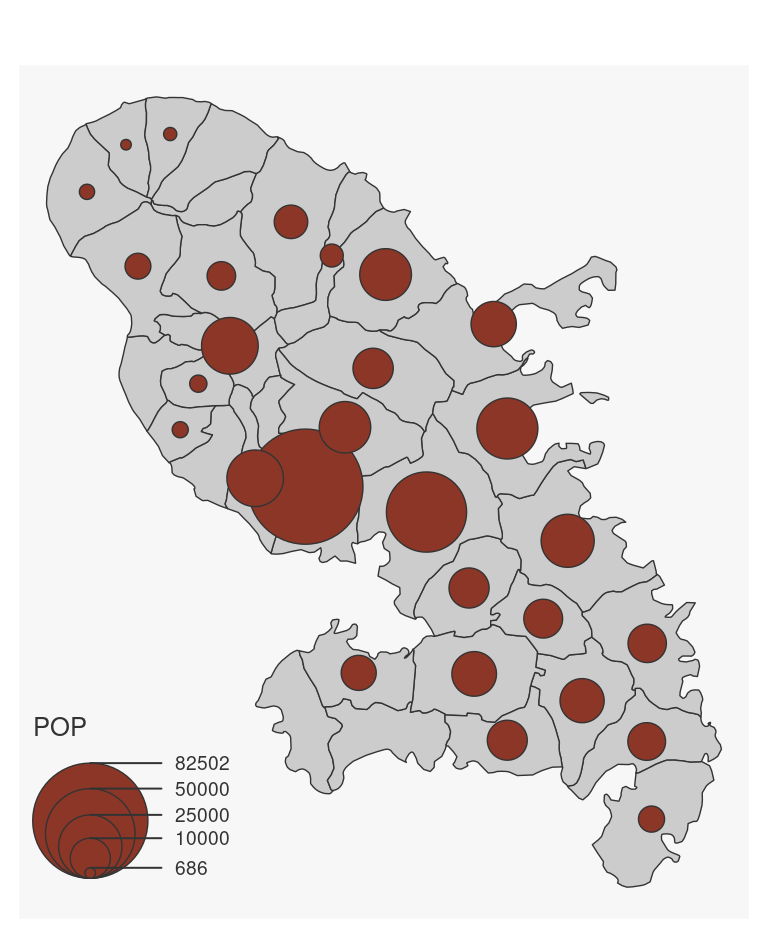
mf_get_breaks() is a function that helps to classify continuous variables using various methods, including the ones from classInt::classIntervals (Bivand 2022). A control has been added for Inf values and the geom method now outputs an error when all values are not strictly positive.
It is now possible to create maps with only one proportional symbol. This can be useful when maps are generated iterating over multiple territories: some of them may have only one point to plot (see issue #45).
opar <- par(mfrow = c(1,2))
mtq <- mf_get_mtq()
mf_map(mtq[8:9,])
mf_map(x = mtq[8:9, ], var = "POP", type = "prop",
       val_max = 85000, leg_pos = "bottomleft")
mf_map(mtq[10,])
mf_map(x = mtq[10, ], var = "POP", type = "prop",
       val_max = 85000)
par(opar)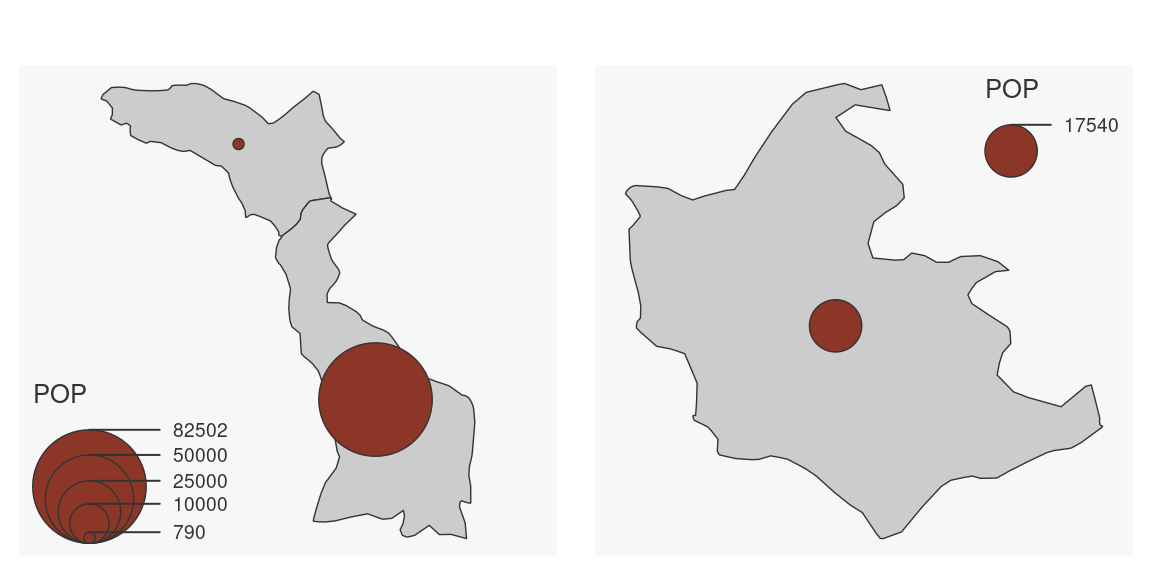
See the NEWS file for the complete list of changes.