mapsf focuses on creating thematic maps based on vector data, maps are mainly generated from sf objects.
However, the latest update of mapsf (v0.9.0) expands its mapping capabilities for raster data. Emulating features from terra (and leveraging its plotting functions internally), mf_raster() now provides three map types for single band rasters: classes, continuous, and interval.
Raster maps benefit from all map layout elements (title, scale bar, north arrow, graticules…) and can be mixed with vector objects.
Download datasets used in examples:
Classes
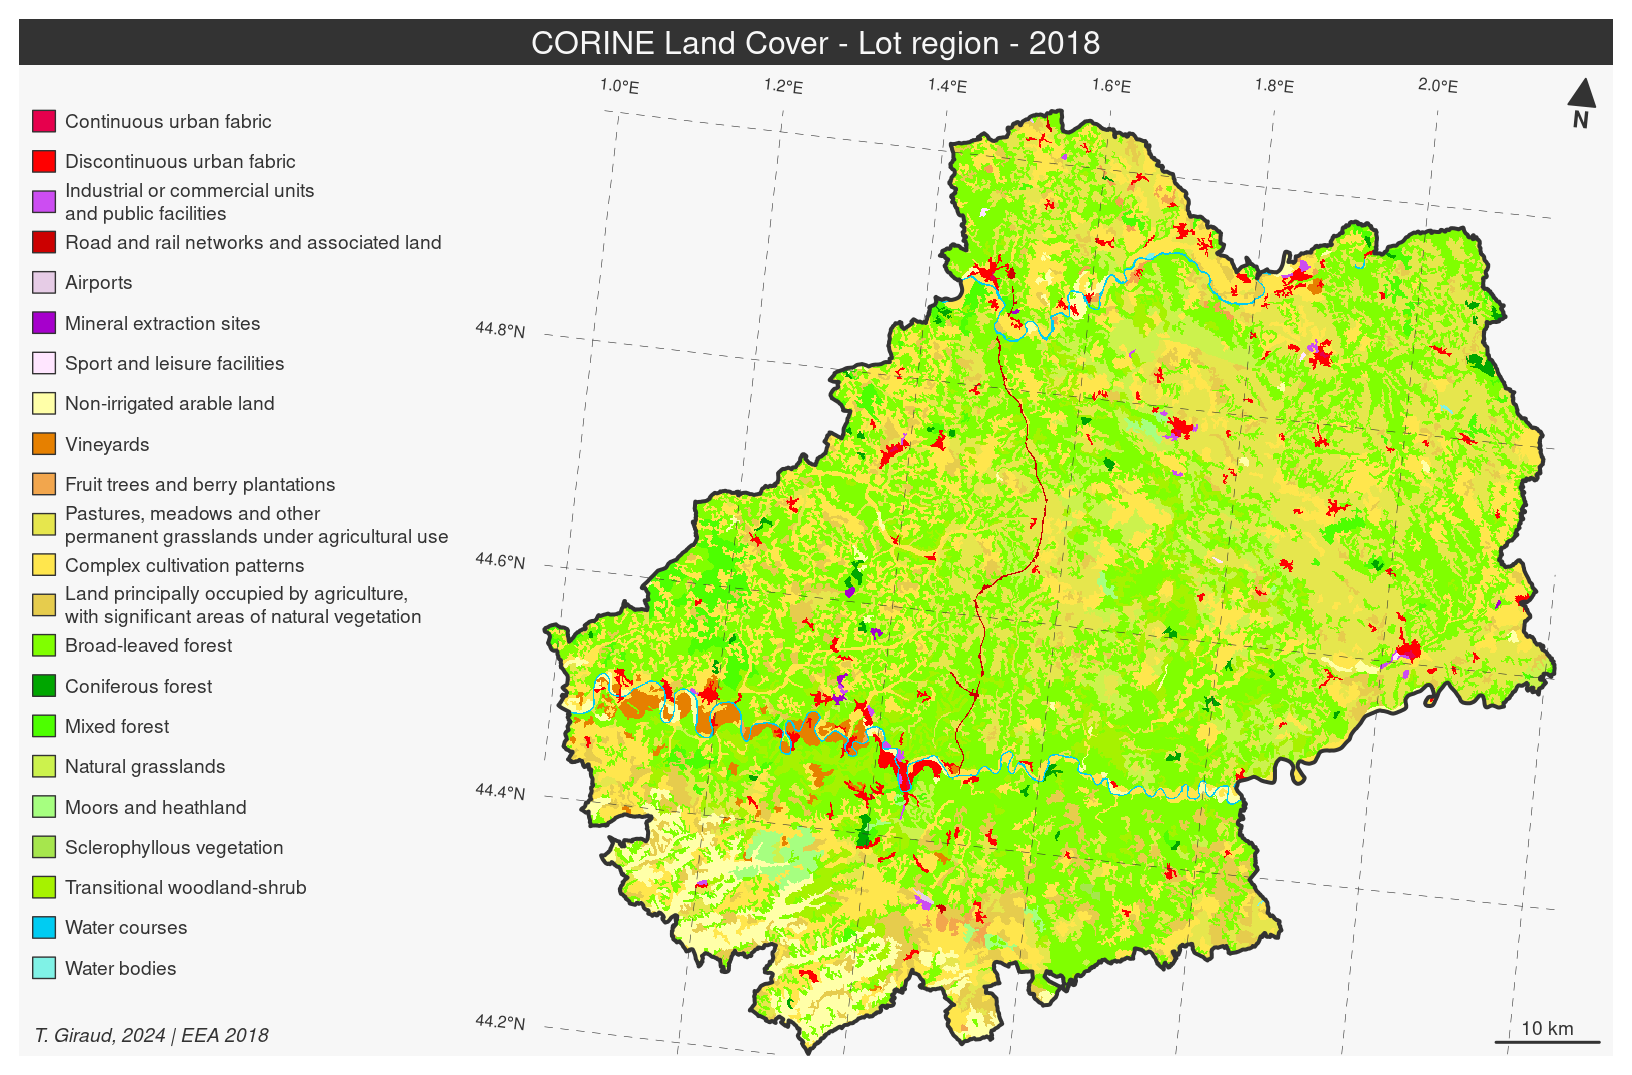
This type of map is suitable for qualitative data (categories, typologies).
In this example we display a map of Corine Land Cover classes over the Lot region in France.
library(mapsf)# import rasterclc <- terra::rast("clc_46.tif")# import vector (Lot region polygon)dep <- sf::st_read("dep.gpkg", "dep", quiet =TRUE) # define a color paletteclc_pal <-c("#E6004D", "#FF0000", "#CC4DF2", "#CC0000", "#E6CCE6", "#A600CC", "#FFE6FF", "#FFFFA8", "#E68000", "#F2A64D", "#E6E64D", "#FFE64D", "#E6CC4D", "#80FF00", "#00A600", "#4DFF00", "#CCF24D", "#A6FF80", "#A6E64D", "#A6F200", "#00CCF2", "#80F2E6")# map the rastermf_raster(clc, pal = clc_pal, expandBB =c(0, 0.5, 0.05, 0),leg_title ="", leg_size = .7, leg_box_cex =c(.6, .85),leg_pos ="topleft")# add region borders mf_map(dep, col =NA, lwd =2, add =TRUE)# add graticulesmf_graticule(clc, lty =2, lwd = .3, cex =0.5, col ="grey20")# add map layout elementsmf_title("CORINE Land Cover - Lot region - 2018", tab =FALSE, pos ="center") mf_credits("T. Giraud, 2024 | EEA 2018")mf_arrow(pos ="topright", adjust = clc)mf_scale(10)
Continuous
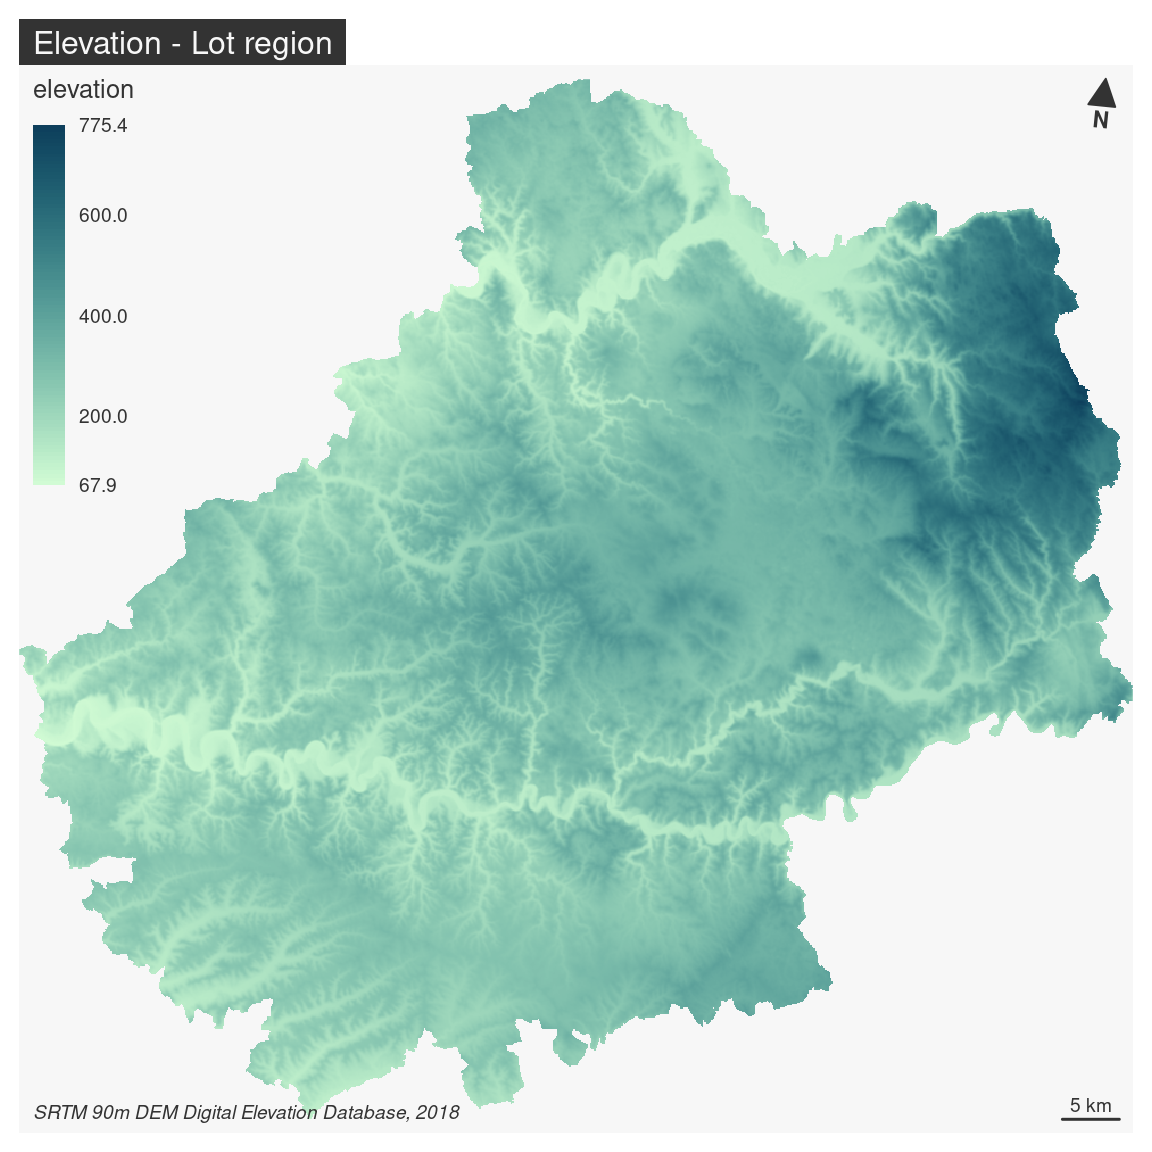
This type of map is appropriate for quantitative data such as DEM, surface temperature or vegetation index.
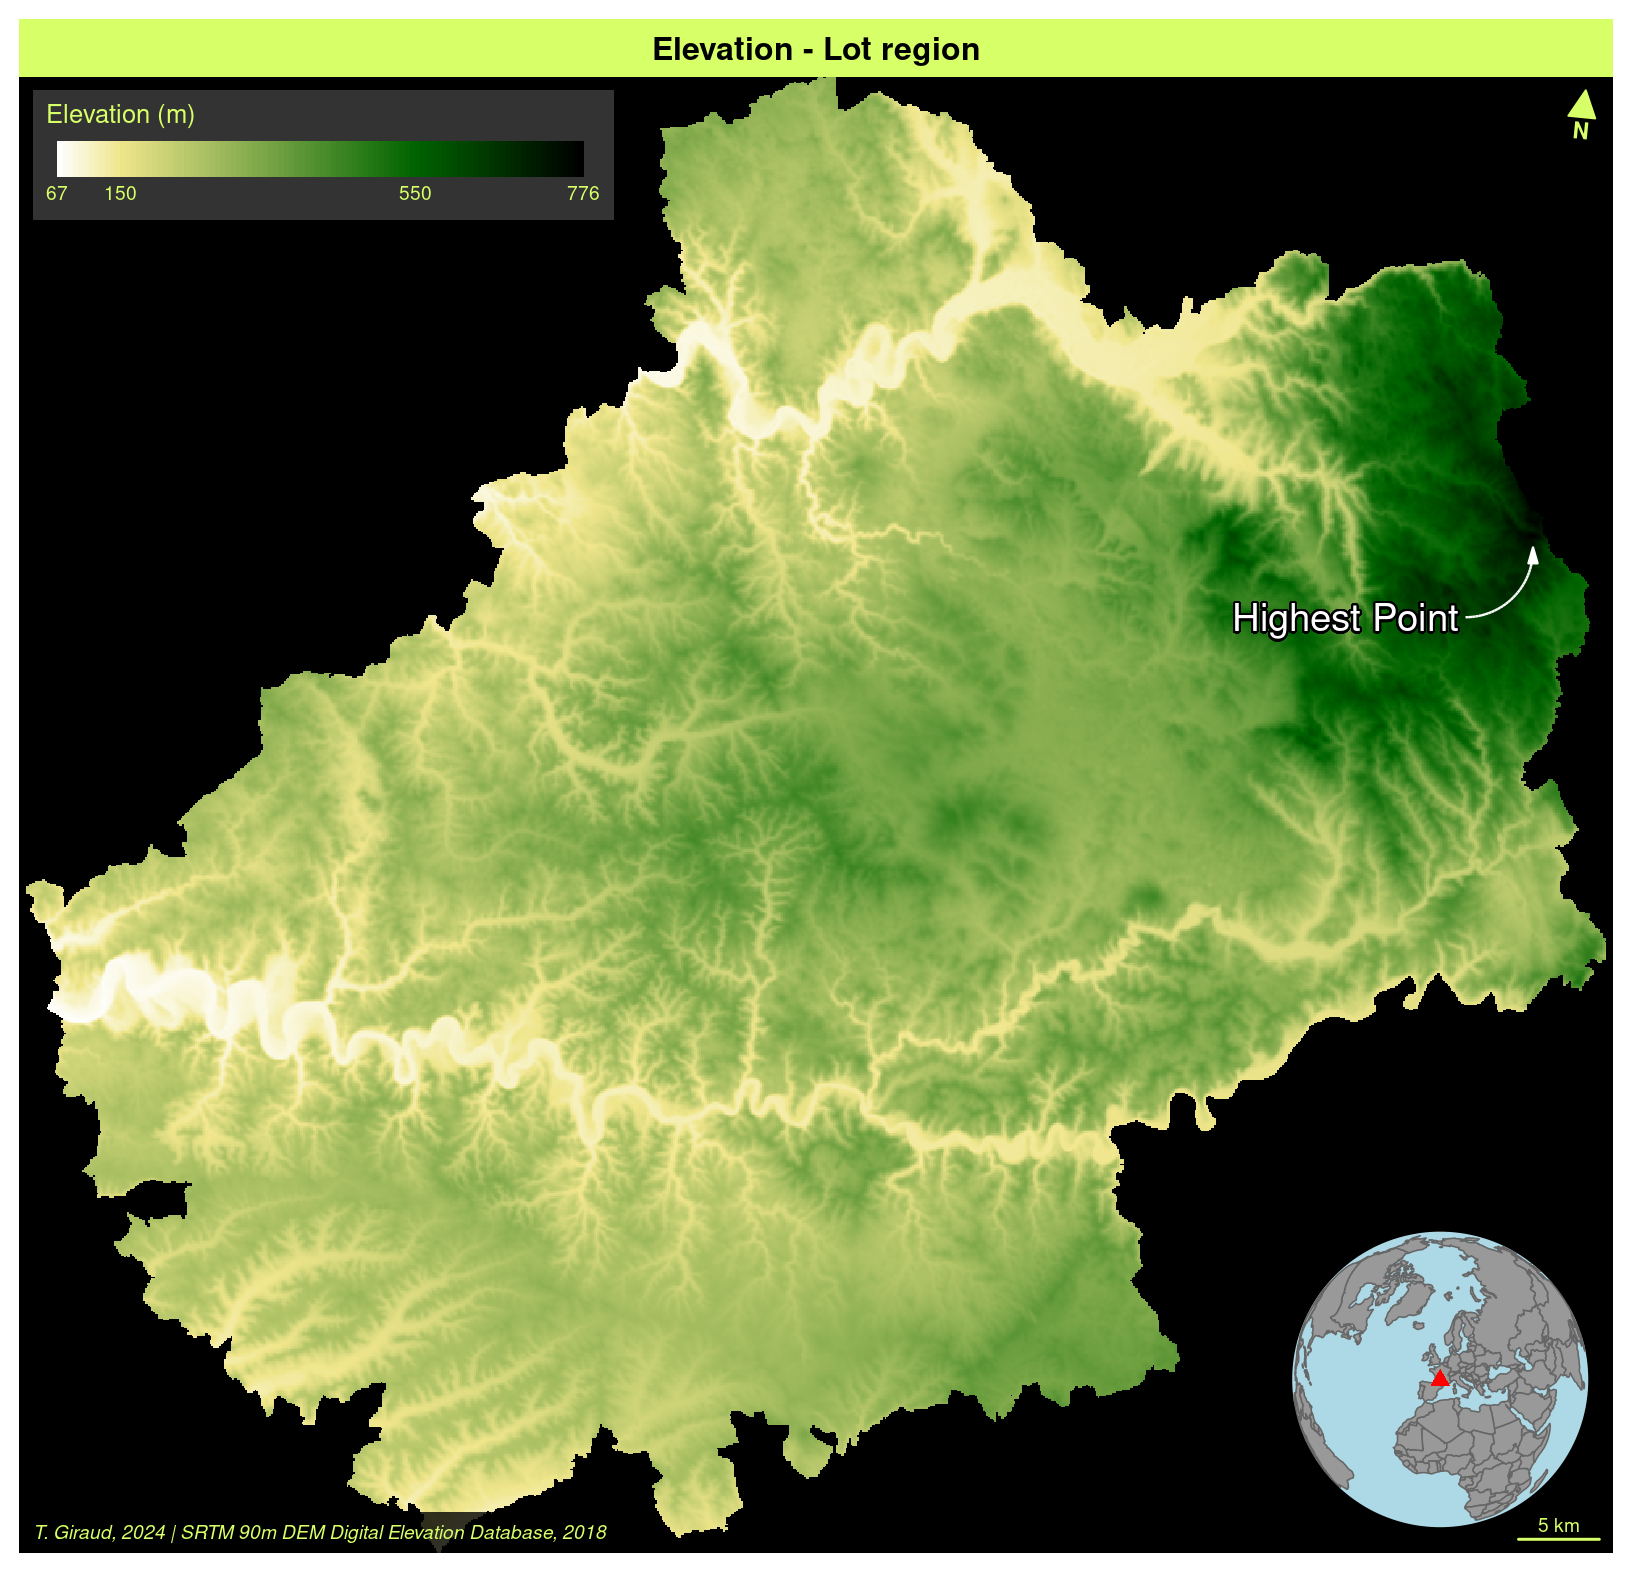
In the following examples we display elevation maps of the Lot region.
# import rasterelev <- terra::rast("elev_46.tif")# map the rastermf_raster(elev, leg_pos ="topleft")# add layout elementsmf_title("Elevation - Lot region") mf_credits("SRTM 90m DEM Digital Elevation Database, 2018")mf_arrow(pos ="topright", adjust = elev)mf_scale(5)
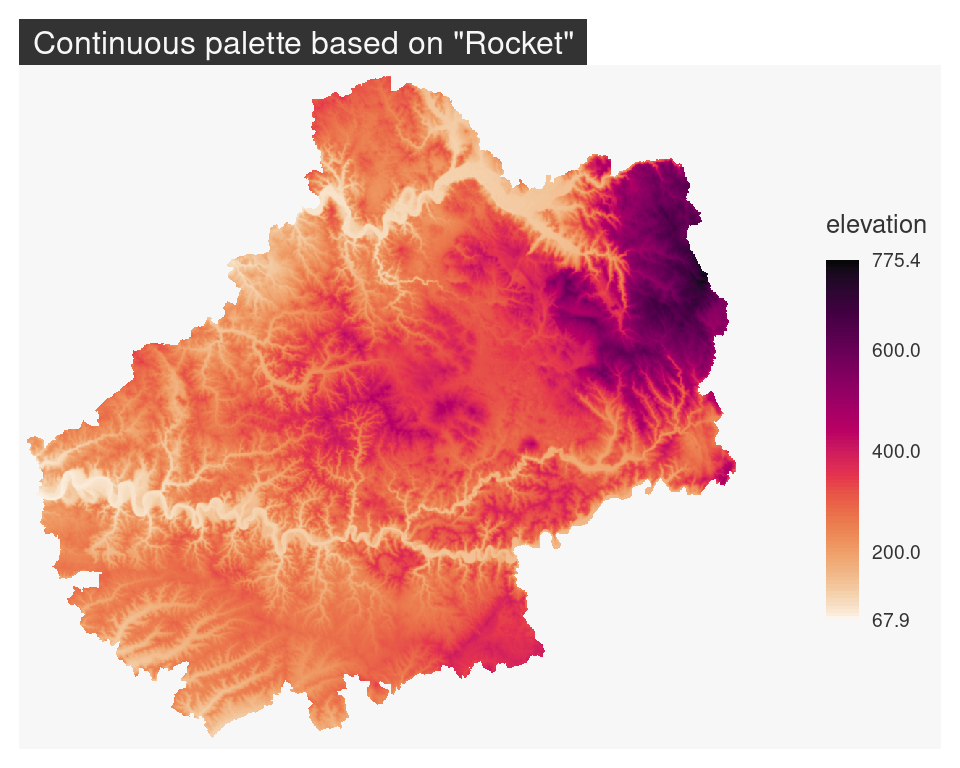
The colors are set using a palette name or a vector of colors to map the continuous values.
See ?hcl.colors() examples to check palette names and colors.
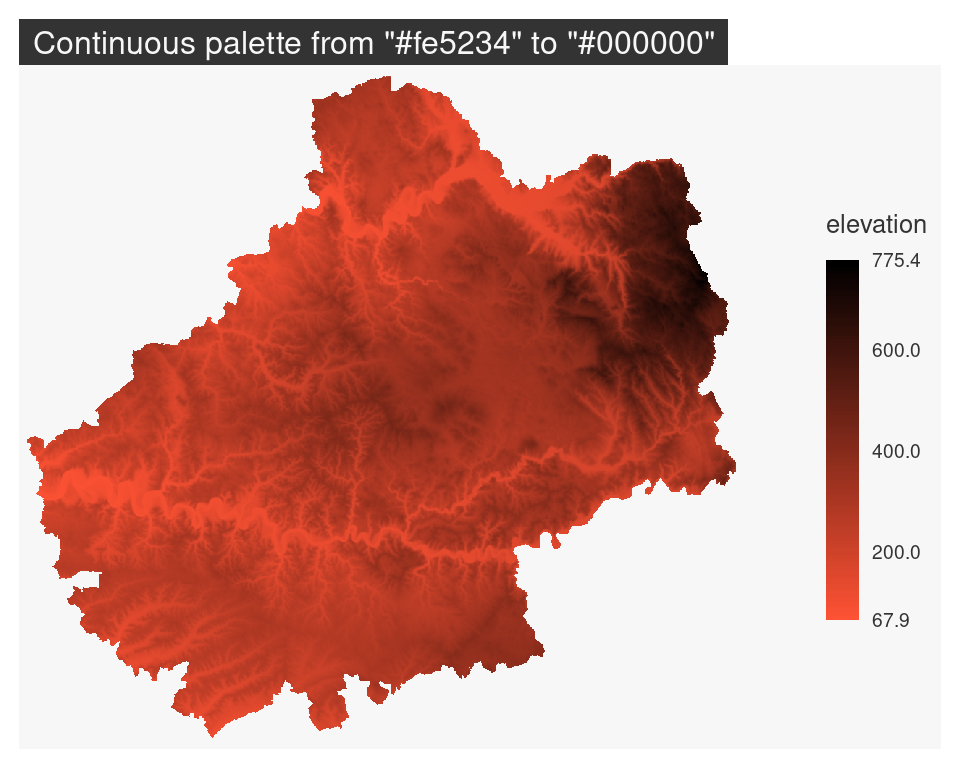
# select a palette with a palette namemf_raster(elev, pal ="Rocket", expandBB =c(0,0,0,.3))mf_title('Continuous palette based on "Rocket"')# define a palette with colors (from red to black)mf_raster(elev, pal =c("#fe5234", "#000000"), expandBB =c(0,0,0,.3))mf_title('Continuous palette from "#fe5234" to "#000000"')
It is also possible to give break values and corresponding colors. Breaks are inflection points of the color scale. In this example the color palette varies from white to khaki between 67 and 150, then from khaki to darkgreen between 150 and 550, and finally from darkgreen to black between 550 and 776.
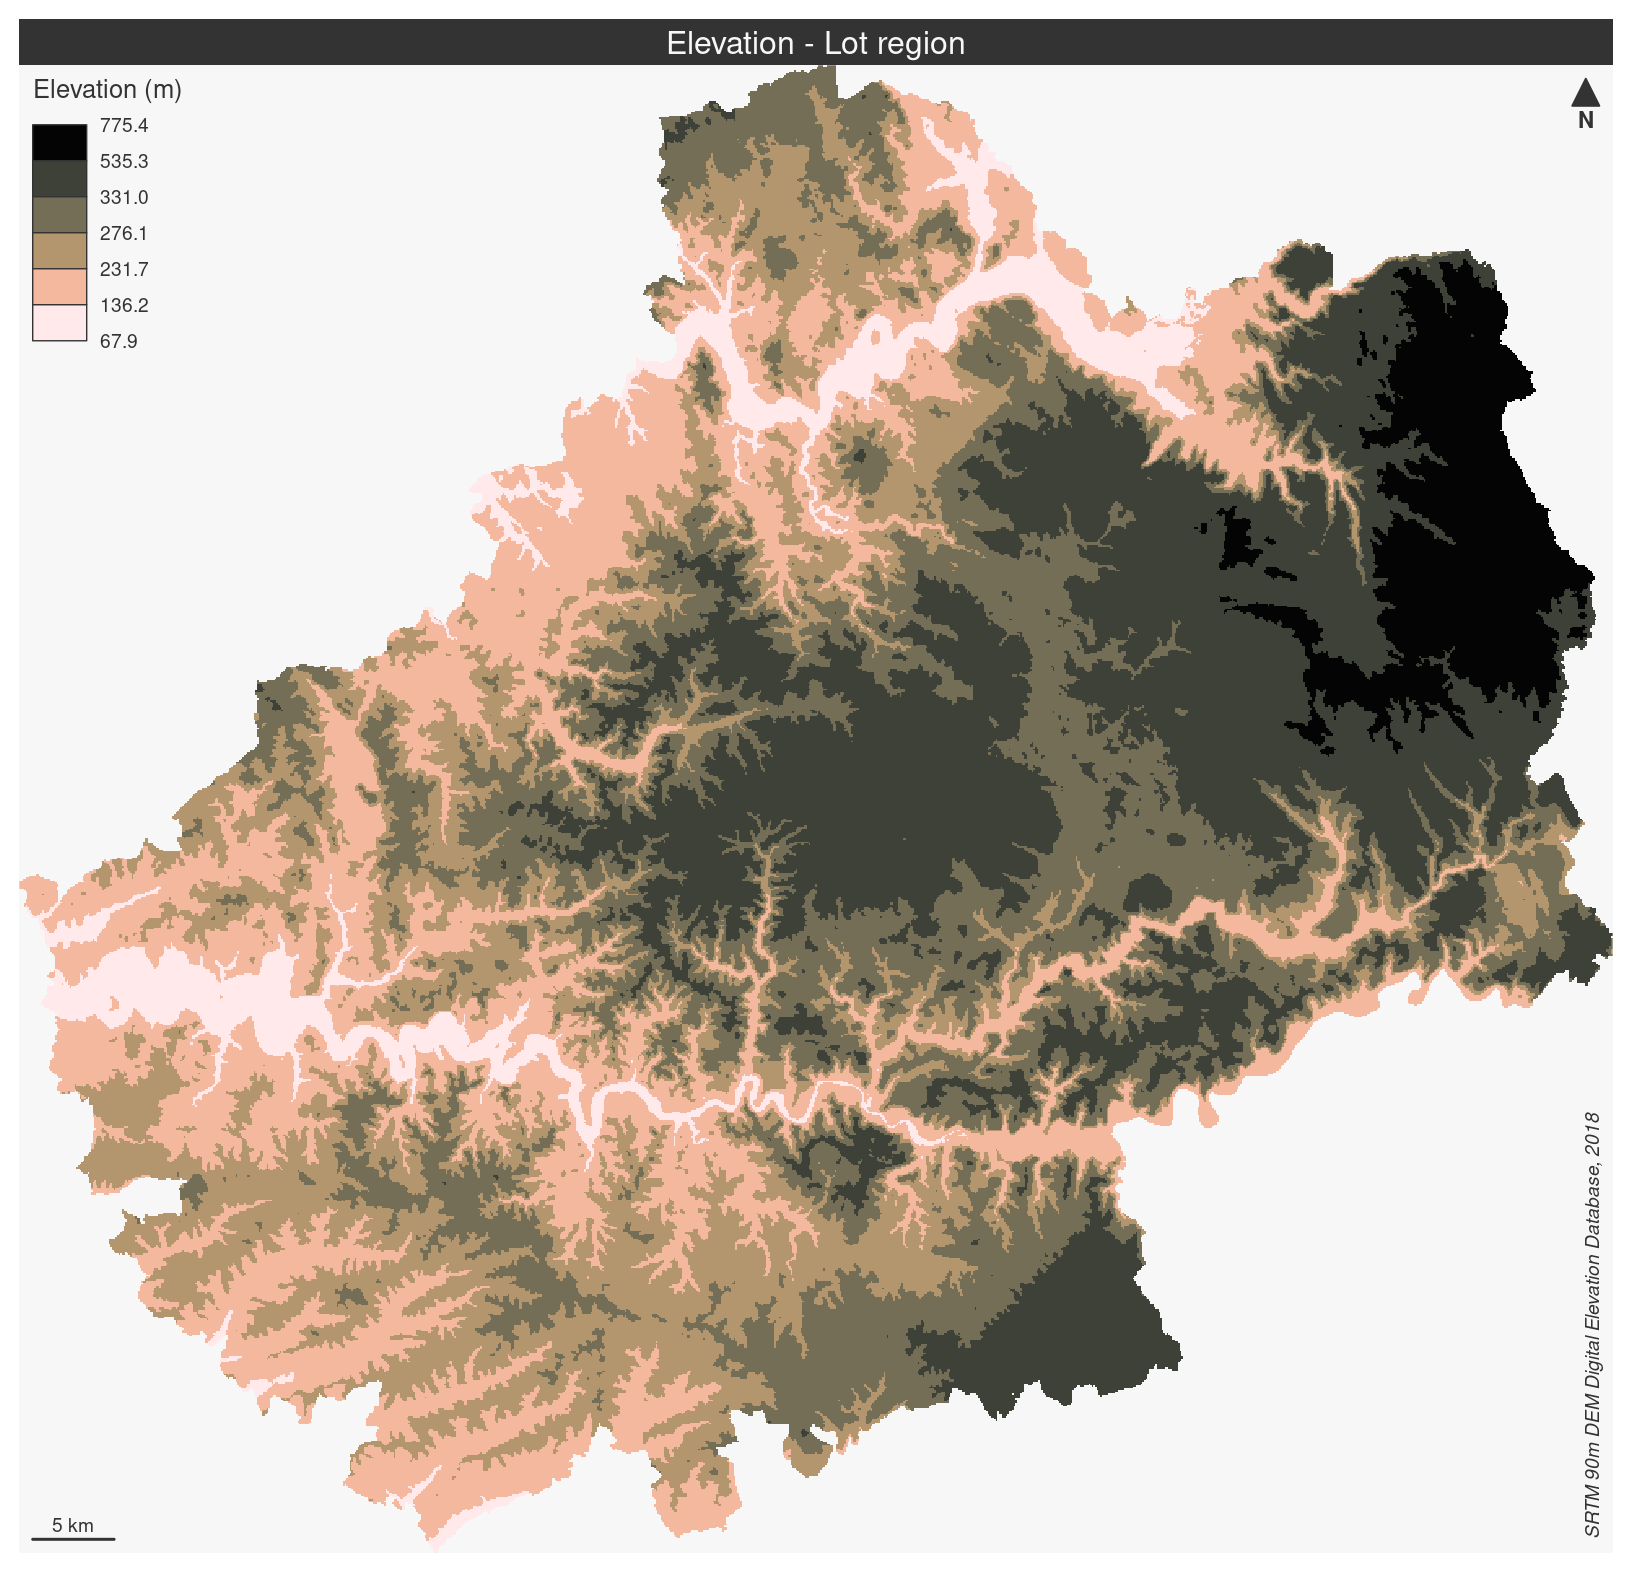
This type of map is also appropriate for quantitative data.
Numerical values are classified using one the methods provided by mf_get_breaks().
# set a cartographic thememf_theme("default")# map the rastermf_raster(elev, type ="interval", breaks ="q6", pal ="Turku", rev =TRUE,leg_val_rnd =1, leg_pos ="topleft", leg_title ="Elevation (m)")# add layout elementsmf_title("Elevation - Lot region", tab =FALSE, pos ="center") mf_credits("SRTM 90m DEM Digital Elevation Database, 2018", pos ="rightbottom")mf_arrow(pos ="topright")mf_scale(5, pos ="bottomleft")
Multiband
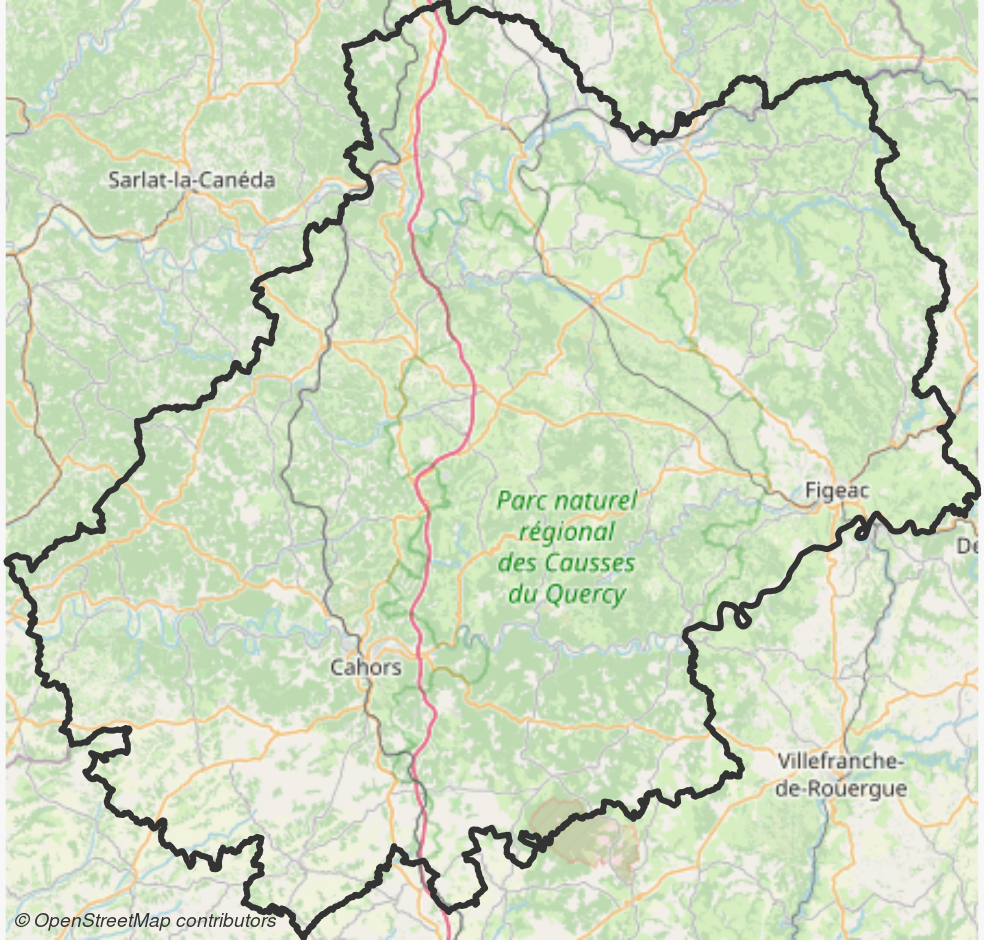
The last kind of map that mf_raster() can take care of is RGB composite maps using three bands.
In the following example we download an image from Open Street Map and display it.
library(maptiles)dep <- sf::st_transform(dep, "EPSG:3857")# get an OpenStreetMap image on the region(osm <-get_tiles(x = dep, provider ="OpenStreetMap", crop =TRUE, zoom =9))
# set them marginsmf_theme(mar =c(0,0,0,0))# display the mapmf_raster(osm)# add region limitsmf_map(dep, add =TRUE, col =NA, lwd =3)# add attributionmf_credits(get_credit("OpenStreetMap"))